Show server side response timings in chrome developer tools
While trying to add additional performance annotations to one of my side projects I recently stumbled over the exceptionally promising Server-Timing HTTP header and specification. It’s a simple way to add semi-structured values describing aspects of the response generation and how long they each took. These can then be processed and displayed in your normal web development tools.
In this post I’ll show a simplified example, using Flask, to add timings to a single page response and display them using Google Chrome developer tools. The sample python flask application below returns a web page consisting of a single string and some fake information detailing all the actions assembling the page could have required.
# cat hello.py

from flask import Flask, make_response
app = Flask(__name__)


@app.route("/")
def hello():

    resp = make_response('Returned from hello')

    # Collect all the timings you want to expose
    # each string is how long it took in microseconds
    # and the human readable name to display
    sub_requests = [
        'redis;dur=0.1;desc="Redis"',
        'mysql;dur=2.1;desc="MySQL"',
        'elasticsearch;dur=1.2;desc="ElasticSearch"'
    ]

    # Convert timings to a single string
    timings = ', '.join(sub_requests)

    resp.headers.set('Server-Timing', timings)

    return resp
Once you’ve started the application, with FLASK_APP=hello.py flask run,
you can request this page via curl to confirm the header and values
are present.
    $ curl -sI http://127.0.0.1:5000/ | grep Timing
    ...
    Server-Timing: redis=0.1; "Redis", mysql=2.1; "MySQL", elasticsearch=1.2; "ElasticSearch"
    ...
Now we’ve added the header, and some sample data, to our tiny Flask
application let’s view it in Chrome devtools. Open the developer tools
with Ctrl-Shift-I and then click on the network tab. If you hover the
mouse pointer over the coloured section in “Waterfall” you should see an
overlay like this:
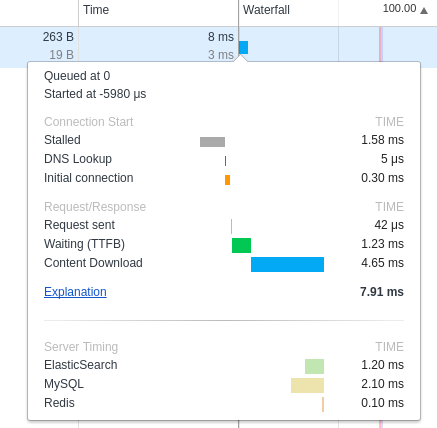
The values provided by our header are at the bottom under “Server Timing”.
Support for displaying the values provided with this header isn’t yet
wide spread. The example, and screenshot, presented here are from Chrome
62.0.3202.75 (Official Build) (64-bit) and may require changes as the
spec progresses from its current draft status. The full potential of the
Server-Timing header won’t be obvious for a while but even with only a few
supporting tools it’s still a great way to add some extra visibility to your
projects.