Adding AlertManager to docker-compose Prometheus
What’s the use of monitoring if you can’t raise alerts? It’s half a solution at best and now I have basic monitoring working, as discussed in Prometheus experiments with docker-compose, it felt like it was time to add AlertManager, Prometheus often used partner in crime, so I can investigate raising, handling and resolving alerts. Unfortunately this turned out to be a lot harder than ‘just’ adding a basic exporter.
Before we delve into the issues and how I worked around them in my implementation let’s see the result of all the work, adding a redis alert and forcing it to trigger. Ignoring all the implementation details for now we need to do four things to add AlertManager to our experiments:
- add the AlertManager container
- tell Prometheus how to contact AlertManager
- tell Prometheus where the alert rules files are located
- add an alerting rule to confirm everything is connected
Assuming we’re in the root of
docker-compose-prometheus
we’ll run our docker-compose command to create all the instances we need for
testing:
docker-compose \
  -f prometheus-server/docker-compose.yaml   \
  -f alertmanager-server/docker-compose.yaml \
  -f redis-server/docker-compose.yaml        \
up -d
You can confirm all the containers are available by running:
docker-compose \
  -f prometheus-server/docker-compose.yaml   \
  -f alertmanager-server/docker-compose.yaml \
  -f redis-server/docker-compose.yaml        \
ps
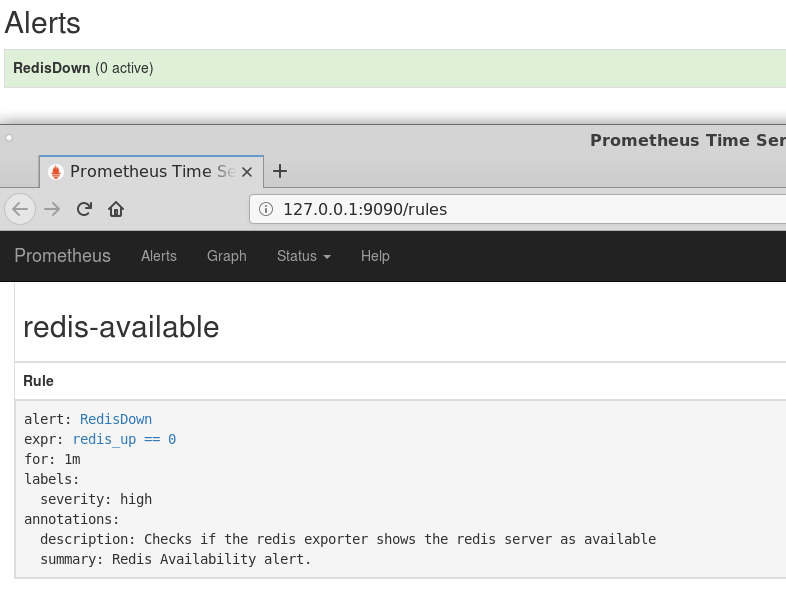
In this screenshot you can see the Prometheus alerting page, with our RedisDown
alert against a green background as everything is working correctly. We also
show the
RedisDown AlertManager rule configuration.
This rule checks the redis_up value returned by the redis exporter. If
redis is down it will be 0, and if it doesn’t recover in the next minute it
will trigger an alert. It’s worth noting here that you can confirm your rules files are
valid using this, less scary than it looks, promtool command:
# the left hand argument to `-v` is the local file from this repo.
docker run \
  -v `pwd`/redis-server/redis.rules:/fileof.rules \
  -it --entrypoint=promtool prom/prometheus:v2.1.0 check rules /fileof.rules

Checking /fileof.rules
  SUCCESS: 1 rules found
Everything seems to be configured correctly, so lets break it and
confirm alerting is working. First we will kill the redis container.
This will cause the exporter to change the value of redis_up.
# kill the container
docker kill prometheusserver_redis-server_1

# check it has exited
docker ps -a | grep prometheusserver_redis-server_1

# simplified output
library/redis:4.0.8    Exited (137) 2 minutes ago    prometheusserver_redis-server_1
The alert will then change to “State PENDING” on the prometheus alerts page. Once the minute it up it will change to “State FIRING” and, if everything is working, appear in AlertManager too.
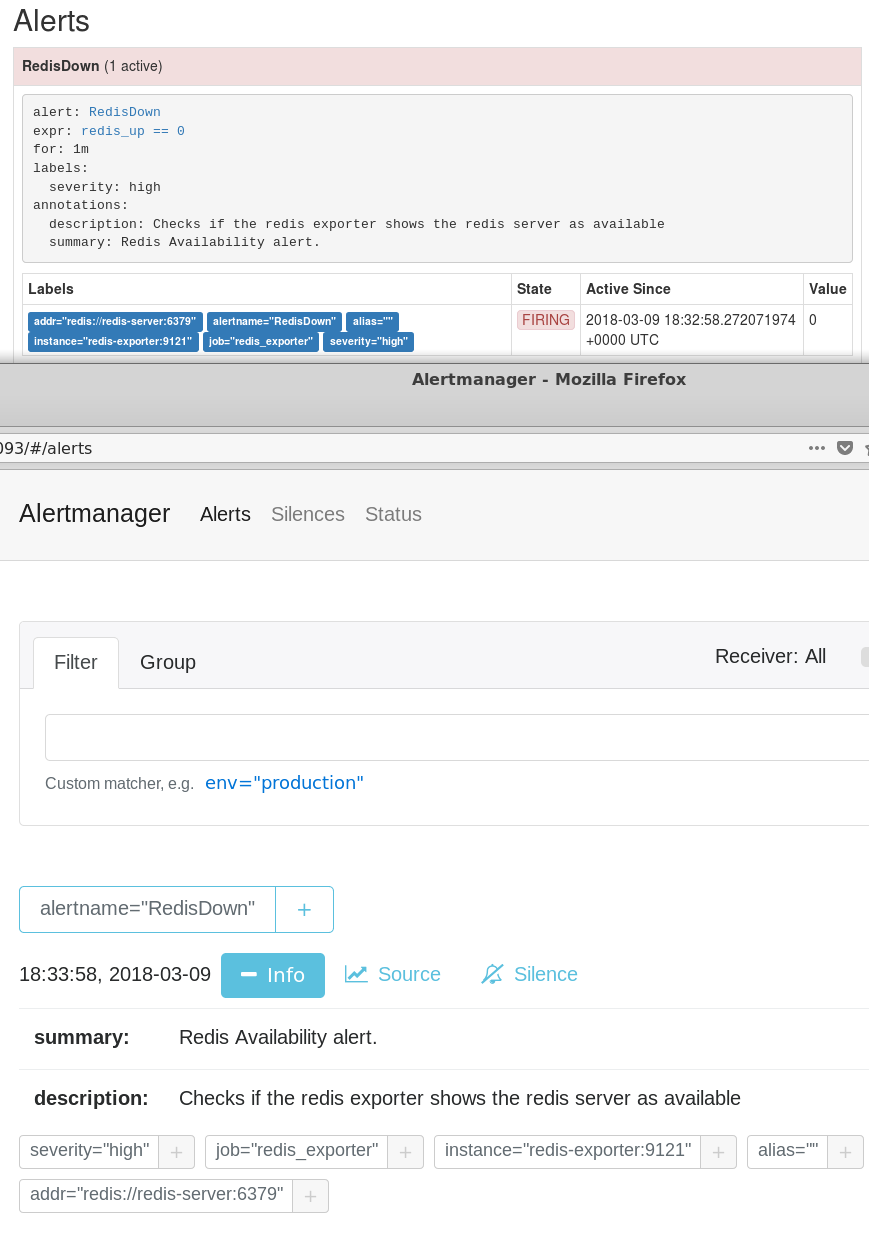
In addition to using the web UI you can directly query alertmanager via the command line using the docker container
docker exec -ti prometheusserver_alert-manager_1 amtool \
  --alertmanager.url http://127.0.0.1:9093 alert

Alertname  Starts At                Summary
RedisDown  2018-03-09 18:33:58 UTC  Redis Availability alert.
At this point we have a basic but working AlertManager running alongside our local prometheus. It’s far from a complete or comprehensive configuration, and the alerts don’t yet go anywhere, but it’s a solid base to start your own experiments from. You can see all the code to make this work in the add_alert_manager branch
Now we’ve covered how AlertManager fits into our tests and how to confirm it’s working we will delve into how it’s configured, something that was much more work than I expected. Prometheus, by design, runs with a single configuration file. While this is fine for a number of use cases, my design goal of combining any combination of docker-compose files to create a test environment doesn’t play well with it. This became clear to me when I needed to add the alertmanager configuration to the main config file, but only when alertmanager is included. The config to enable AlertManager and its alerting rules is concise:
rule_files:
  - "/etc/prometheus/*.rules"

alerting:
  alertmanagers:
    - static_configs:
      - targets: ['alert-manager:9093']
The first part, rule_files:, accepts wild card selection of alert
rule files. Each of these files contain one of more alert rules, such as
our RedisDown example above. This globbing makes it easy to add rules
to prometheus from each included component. The second part tells
prometheus where it can find the alertmanager instance it should raise
alerts with.
In order to use these configs I had to add another step to running prometheus; collecting all the configuration snippets and combining them into a single file before starting the process. My first thought was to create my own Prometheus container and preprocess the configuration before starting the daemon. I quickly decided against this as I don’t want to be responsible for maintaining my own fork of the Dockerfile. I was also worried about timing issues and start up race conditions from all the other containers adding their configs. Instead I decided to [add another container](https://github.com/deanwilson/docker-compose- prometheus/pull/9).
This tiny busybox based container, which I named promconf-concat, runs a short shell script in a loop. This code concatenates all the configuration fragments, starting with the base config, together. If the complete config file has changed it replaces the existing, volume mounted, file which prometheus then detects as changed and reloads.
I have a strong suspicion I’ll be revisiting this part of the project
again and splitting the fragments more. Adding ordering will probably be
required as some of the exporters (such as MySQL) can’t be configured as
targets via the file_sd_configs mechanism. However for now it’s allowed me to
test the basic alerting functionality and continue to delver more deeply into
Prometheus.