Building the Organisation Graph
While it’s said a lot of Open Source software is written to scratch an itch sometimes it’s written to stop that gentle but persistent itch behind the back of your eyeball that makes you twitch every time a subject comes back up. After another quarterly set of changes, teams, missions and all the associated admin overhead and metadata I decided I could no longer face a disparate, possibly consistent but probably not, batch of un-version controlled Google Sheets. So I decided to have a play with a different approach - stuffing everything into a GraphDB.
The organisation-graph is a small side project to experiment with trying to get as much relevant organisational data as possible into one place and then seeing what falls out. At this early stage it’s basically tracking people in teams and the services they support but I’d like to extend it to include things like skills assessment and staff capability tracking in relation to the services we run. For example how many people on the team know all the core technologies their service uses to a level they’d feel comfortable supporting out of hours? And who in the organisation rates them self as advanced enough to help with the training?
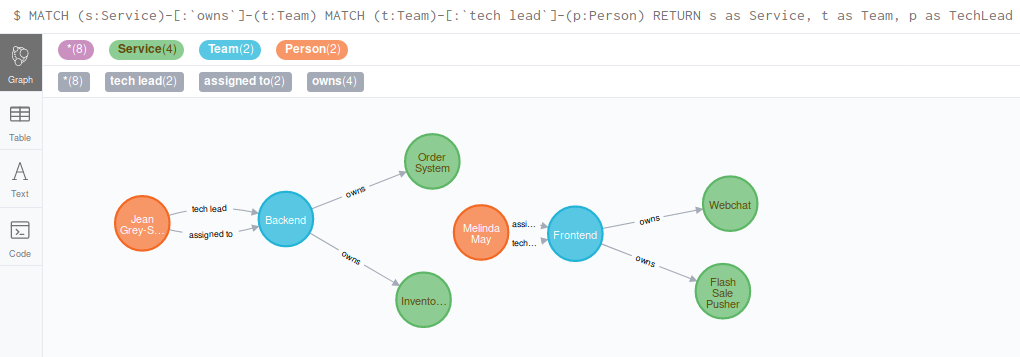
It’s very early days but I’ve put a small selection of Organisation Graph example queries together to show what you can currently search for. One example is showing which technical leads are responsible for what services.
Other plans include building a lot of a small departments basic structural documentation from the model. Organisation charts, internal communities and basic service landing pages should all fall out of this without too much difficulty. I’m not using this at $WORK, trying to convince all the stakeholders to use git, and log reasons for changes, requires more energy than I have but I find the problem interesting enough to spend some of my spare time fiddling around the edges of it. And I can always scrape those sheets and load the data if I find it useful enough.
In terms of technology it’s all Neo4J and Python 3. I’ve never worked with a GraphDB before and while a dockerised Neo4J is very easy to get up and running I’ve found it quite bereft of useful examples of using it from Python. So far A micro blog application powered by Flask and Neo4j has been the best self-contained Python/Neo4J demo I’ve found. Due to my small data set sizes I’m not completely convinced that I couldn’t match the functionality I’m currently using in a relational database and be on much more familiar ground but I am quite enjoying learning something completely new to me.