Visualise recruitment process stages with sankey diagrams
“How can I better show where we lose potential employees in a recruitment process?” has been playing on my mind. I’m happy to look at a basic Google Sheet but occasionally you need something more visually arresting to hold an audiences attention. I decided to do a few short experiments with representing the data using a Sankey diagram and I think they might be helpful.
The example recruitment workflow I used is a simple one:
-
Applicant applies
-
CV is sifted. Candidate passes to the next stage or is rejected.
-
A light technical phone interview happens. Candidate passes to the next stage or is rejected.
-
A heavier, in time and questions, face to face interview which delves into technical breadth and ability to work in diverse, multidisciplinary teams.
-
The candidate is either made an offer or rejected. This is the stage where the candidate has a strong view of if the role and package is for them.
I added some example numbers to a little bit of JavaScript diagramming code and ended up with:
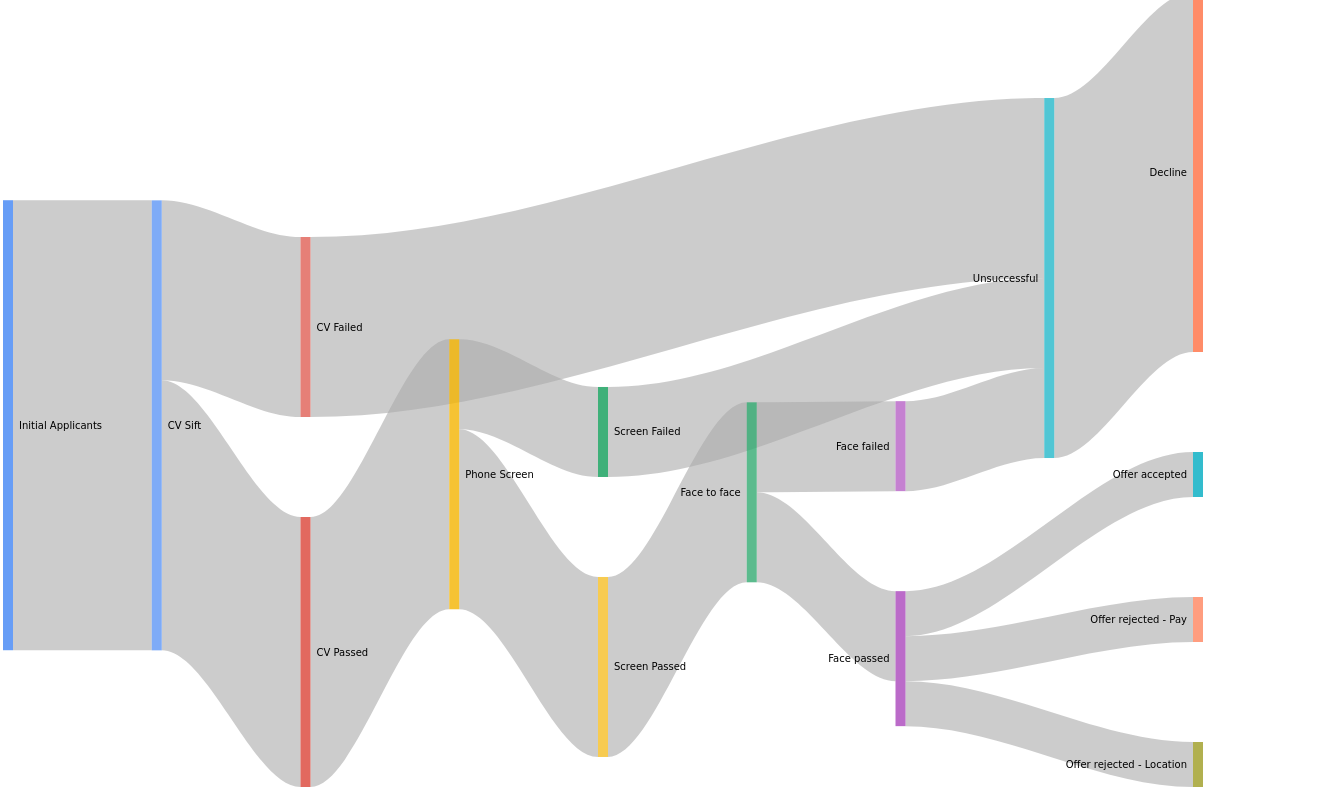
I think this is quite a clear representation of the relative success and failure rates at each stage but it is very explicit at each step. I tried a few cut down versions with the success and failure at each stage being implicit.
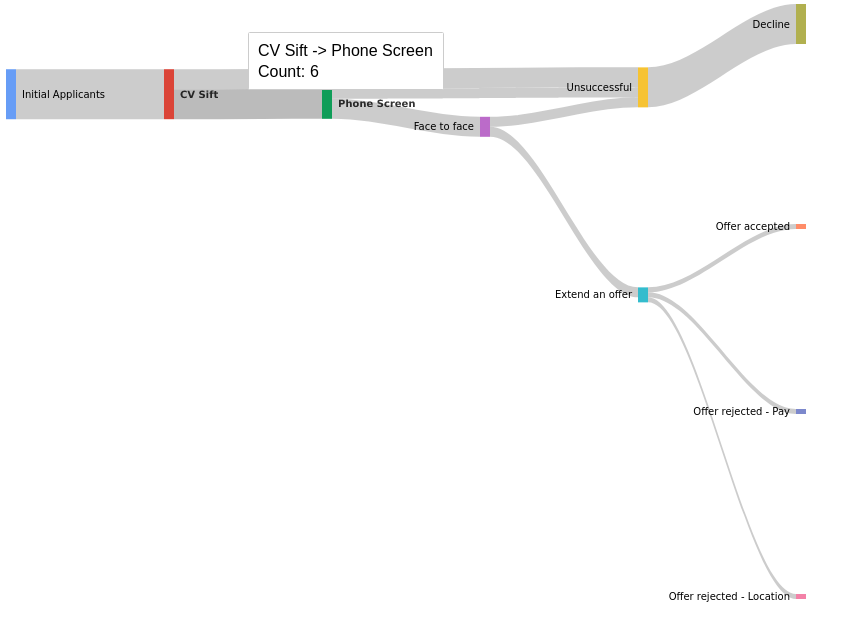
The code is very similar between the two, it mostly differs in the
data.addRows block. I’m sure you could make the resulting output
prettier but this is good enough for my prototype.
<html>
<body>
<script type="text/javascript" src="https://www.gstatic.com/charts/loader.js"></script>

<div id="sankey_multiple" style="width: 800px; height: 600px;"></div>

<script type="text/javascript">
  google.charts.load("current", {packages:["sankey"]});
  google.charts.setOnLoadCallback(drawChart);
   function drawChart() {
    var data = new google.visualization.DataTable();
    data.addColumn('string', 'From');
    data.addColumn('string', 'To');
    data.addColumn('number', 'Count');

    data.addRows([
       [ 'Initial Applicants', 'CV Sift', 10 ],
       [ 'CV Sift', 'Unsuccessful', 4 ],
       [ 'CV Sift', 'Phone Screen', 6 ],
       [ 'Phone Screen', 'Face to face', 4 ],
       [ 'Phone Screen', 'Unsuccessful', 2 ],
       [ 'Face to face', 'Extend an offer', 2 ],
       [ 'Face to face', 'Unsuccessful', 2 ],

       // Success!
       [ 'Extend an offer', 'Offer accepted', 1 ],

       // Artificial stage to show how many candidates are rejected
       [ 'Unsuccessful', 'Decline', 8 ],

       // Successful candidates that reject *us*
       [ 'Extend an offer', 'Offer rejected - Pay', 1],
       [ 'Extend an offer', 'Offer rejected - Location', 1],
    ]);

    // Set chart options
    var options = {
      width: 800,
      height: 600,
      sankey: { node: { nodePadding: 180 } },
    };

    // Instantiate and draw our chart, passing in some options.
    var chart = new google.visualization.Sankey(document.getElementById('sankey_multiple'));
    chart.draw(data, options);
   }
</script>
</body>
</html>
Once you have the basic flow displaying you can change the input dataset in interesting ways and compare the points where you lose candidates. If you only include candidates with a specific gender or from under represented groups do you see the similar percentages leave at the same exit points? Or do you notice anything odd about where they leave the process? If it’s very different between types of input data it can be eye opening to delve into the results from that stage to help identify if you’ve got an implicit bias influencing the outcomes or even just a few duff questions costing you a chunk of otherwise suitable candidates.
Things can also work the other way, if you’re losing a high percentage of candidates at the expensive face to face stage maybe a revision of the phone screen questions to help remove candidates earlier in the process would be a win. Anything you can do to fine tune the process in ways that protect the time and effort, especially if you do on-site interviews, of your staff and the candidate is worth looking into as you attempt to scale up your recruitment.